For a while, the daily briefings in the UK have included the chart below (source here). More recently it has also included a 7-day rolling average as an additional line. In fast changing times this is very bad practice because there is a systematic lag between the pattern in the daily data and the pattern in the rolling 7-day period. Notice how the bar chart seems to reach a natural peak about 4 days before the line - this is misleading.
Whilst this might be acceptable in data that does not change too much (such as steady monthly sales data being rolled up into a Monthly Annual Total, aka an MAT, a very common practice in the pharma industry) it doesn't work well for fast changing data like the example above.
It is much better to use a smoothing approach centred around each data point. On my Covid-19 dashboards I typically use a three-point smoothing, which makes it easy to spot the trend, but given the strong 7-day periodicity of the data (more on this another time) it makes sense to smooth over 7 days, that way you always have one each of both the higher days (Saturday is usually the highest day) and the lower days (Monday is usually the lowest) in the calculation making it easier to tease out the underlying trend.
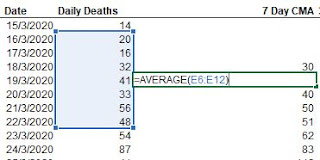
The approach, often called a centred moving average (CMA) is simply an average of each day calculated based on the day itself, the 3 days before and the 3 days afterwards. In excel the calculation looks like this:
Applying this to the data above gives me the following chart:
Notice now how the line follows the pattern of the data rather than the government version which lags behind. See also how much easier it is to work out when the number of fatalities peaked in the UK (about April 10th). Looking closer you can also see how the weekend dips in the data have been almost eliminated and a smooth underlying trend has emerged.
In reality, this is exactly the same curve as obtained using the government reported rolling seven day approach, but it's been shunted back by three days, but see how much more useful it is now.
The only downside of this approach is that it cannot be consistently applied to the first few and last few points where you do not have the full seven values to average over - you can extend the formula in the spreadsheet by all means, but you bias the sample to the points you include, the very last thing you want to do in a fast changing situation. However, it's not usually too difficult to mentally adjust for this and, as in the example above, see that the trend is probably continuing downwards.
As you can now see a CMA-type smoothing is much better than a rolling 7 day number in these circumstances. The next time I see Boris I will let him know.


No comments:
Post a Comment