Wednesday, May 20, 2020

A little more interaction

For the last few days I've been looking at ways to incorporate some of the Covid-19 data into a more interactive format for the blog. It's not been easy. Although there are many tools out there, most of them do not work well once you move from the classic simple charts and I've yet to find a tool that can provide the type of charts I like to craft in Excel. So the quest the a decent BI tool continues. 

But by way of a start please see the widget at the top of the blog showing the country growth trajectories created using Tableau. A full page version can be found here. I've had to make a fair few compromises on the layout and I'm not 100% sold on the approach, but it's a start. 

Gains from this approach include interactivity (if somewhat slow) selecting of countries and also the ability to scroll through 5 weekly data points... hopefully the update cycle will also be much improved (tests on other data analyses have been successful so far). One downside if the inability to join the dots of a scatter chart so you have to rely on unpredictable labelling to see what is happening. 

There's also a single country over time analysis available here I would have embedded the dashboard into the blog, but the auto-code generation module in Tableau is unreliable at best (it took hours of fiddling about to get the one in the header to work correctly). So I'm cutting my losses at this time. 

Any feedback on these analyses would be most welcome.

Monday, May 18, 2020

A Quick Global Update

In general the situation around the world is improving every day with the various lockdown strategies having the desired effect and reducing both the over rate of infection (new cases per 100K population) and the rate of growth (measured as Weekly Growth Rate - New Cases).

The high level view looks like the chart below, with a zoomed in version below that.


A large number of countries have moved downwards and to the right since my last update (which is good news) but there are still several causes for concern.

The big outlier in terms of rate of infection is Qatar - the reported data suggests a level over 350 cases per 100K population (I've replaced the value with 200 to avoid compressing the scale too much) and the rate of growth is still significant. Interestingly it's not the only gulf state still in growth with Kuwait, Oman, Bahrain and Saudi Arabia all featuring in the growth segment.

The other notable group is in South America where Brazil continues to grow whilst having a large number of cases in both relative and absolute numbers. However, we can also see Ecuador, Peru and Chile at risk of an ever increasing number of cases which could cause considerable loading of local health resources.

It looks like Russia has hit the plateau of new cases and is just starting to decline and the same can also be said for Sweden.

Other potential dangers areas with low current cases but a high rate of growth are South Africa, Argentina, Bangladesh and Columbia - hopefully these will not experience rapid rates of growth, but could be concerns over the coming weeks.

As an experiment, I've put some of the data from the analysis above into a new mapping widget (see below). Here we see the rate of new cases per 100K population with the countries coloured in accordingly. I have to say that although there are quite a few issues with the widget, the overall map is not too bad in identifying some of the clusters mentioned above with the Gulf States and South America clearly drawn out. I just wish I had more control over the colouration, scaling and positioning to draw the map I really want to. Oh, well, the search for better mapping tools continues...


Friday, May 15, 2020

Update on Excess Deaths England and Wales (week 18)

Using the latest data from the ONS (which covers week 18 - the week ending May 1st), we get the following pattern for weekly deaths in England and Wales.

Following on from the previous post on this subject, the top line numbers are starting to fall (as would be expected from the regular daily briefings), but weekly numbers are still considerably above historical trend. In the latest week there were just over 8,000 more deaths than might typically be expected.


Looking at the various measures of Covid-19 reporting gives the picture below. There are over 46 thousand more deaths in recent weeks than might normally be expected (please bear in mind this data has a near two-week lag, so several thousand more deaths will have occurred during the lag period).

The ONS are reporting just over 35 thousand deaths due to Covid-19, which I expect to increase to over 36 thousand once reporting catches up. This leaves about ten thousand deaths unaccounted for - which is my worst case estimate for additional Covid-19 deaths during this time.   


Over time the percentage difference between the ONS reporting and the final figure reported weeks later (which I estimate as the ONS Forecast figure) will reduce, since more of the numbers become locked in and the overall death rate starts to fall. We are almost at the point when such adjustments become meaningless, so this may be the last week that I include this in the reporting - I will track the variance over time and see whether the impact is large enough to merit it's ongoing inclusion.

Thursday, May 14, 2020

Update on the US

Please find below the latest trajectory analysis for the US by state. The situation is now looking far more favourable that a week ago, with the majority of the states having moved to the right of the y-axis denoting a decreasing number of new cases. This means that there is a net reduction in the total number of new cases and, barring and major changes in behaviour, should lead to faster levels of decreasing cases nationally as more states start to decline and are no longer offset by increasing case numbers elsewhere. 


Some areas of concern remain with South Dakota, Minnesota and Delaware still growing on a higher than average rate of infection (i.e. new cases per 100K population) and Rhode Island and District of Columbia (D.C) having very high levels of infection around the point of plateau.

California is also of interest - last week the level of new cases was falling, but more recently new cases have started to grow. On a per capita basis this is still fairly low, but the sheer size of local population means that should the infection run out of control case numbers could get very high very quickly. I shall watch this closely over the coming weeks.


Tuesday, May 12, 2020

Update EU 5 and USA

UK:

The number of new Pillar 1 cases continues to fall, as does the daily levels of fatalities - in fact the fatality rate has fallen slightly (relative to new cases) in the last week or so. But we are still seeing 2000 new cases each day, which is a concern since only slight changes in behaviour could see these numbers start to climb again. This higher level of new cases can be seen on the cumulative chart on the left - notice how the line is still growing at a reasonable rate (although no longer straight), compare that shape with France where the equivalent line is much flatter. 


If the trend continues expect daily deaths to stay at about 300 per day (on weekdays) and the Pillar 1 total deaths to reach 28,000 in about a week.


France:

The rate of new daily cases is generally low, with occasional spikes. We are regularly seeing less than a thousand new cases a day, but the short term trend is effectively flat (reminds me of South Korea which ran on stubbornly with a token amount for weeks and weeks). 

The rate of daily deaths have increased of late and have been nearly twice the previous level (based on my lag probability model). Not sure if this indicates a change in the situation of a catch-up in the reporting of earlier deaths.


Expect very similar numbers in the short term with an daily average in the high two-hundreds and a cumulative value approaching 28,000 in a weeks time.


Germany:

Despite some sensationalist reporting in the press, the data from Germany is on a steady downward trend (once the impact of weekend cycles is taken into account).


The overall rate of death determined by my lag-probability model has increased in Germany (but not by as much as in France), but still the overall reported figures are low. I'm still not convinced as to how reflective these numbers are for Germany - but since I cannot find any equivalent to the ONS weekly deaths statistics for Germany comparing 2020 with previous years, that will have to remain a mystery for now.

Expect 50-90 deaths per day to be reported for the next week, bringing the total to over 8,000 by the end of the week.


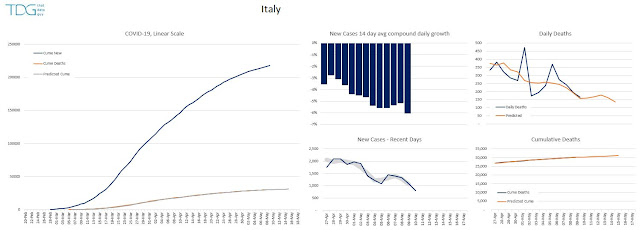
Italy:

The rate of new cases is still declining steadily (now averaging a decrease of 6% per day). but as we can see in the UK, there is still some way to go with over 1000 new cases on most days in the last week.

The rate of daily deaths are following the model's predictions fairly closely, so a very predictable short term pattern appears to be emerging.


Expect daily deaths to average about 160 per day for the next week, bringing the cumulative total up 31,000.


Spain:

The number of daily new cases in Spain refuses to drop at a regular rate. Although the long term trend is downwards there have been several week long periods where the rate of new cases has been steady, and Spain appears to be in another one of these steady-periods at the moment. Hopefully, this is just a precursor to another drop in new cases in the next few days.


Expect daily deaths to average 200 per day for the immediate future with total reported deaths approaching 28,000 in about a week.


USA:

I think this is the first time I've been able to look at the US data and say with any confidence that the rate of new cases is actually decreasing. We've had some wobbles and flat-spots in the data, but now we can see a 2 to 3 week trend where the numbers are really going down. In fact I'm looking forward to updating the data by US state to see how many of the states that previously had growing rates of new cases are now flat and/or in decline.

However, despite the improvement in trend, the underlying numbers are huge with nearly 1.4 million reported cases, although many of these are milder cases than reported elsewhere, leading to a correspondingly lower rate of death (rate of death per new case after time-lag is included is approximately half that of the UK).

Now that (hopefully) many more US states are seeing declining number of new cases, in the coming weeks we should really start to see the rate of decrease start to change (upper middle chart) from the -2% value we have now to something approaching -8%, at which point the US will have really turned the corner.


Expect daily deaths to average 1700 in the next week, with total deaths approaching 90,000 by the end of the week. At the present rate a quick forecast suggests the US will record its 100,000th death on or about May 22nd, but I suspect there may well be some deceleration in the rate over the coming weeks which could push this milestone back a few days. 


Post -Plateau Trends:

And finally, an update on the rate of new cases comparison for Italy, Spain and the UK. Generally we see the same trends emerging with slightly different localised rates. The periodic waves in the data are caused by lower weekend reporting (I'm working on an adjustment for this), so it's best to look at the underlying trends.


Thursday, May 7, 2020

Excess Deaths in the England and Wales - Latest Update

I've been mulling this one over for a while - trying to find a better way to represent what is happening, the size of the issue and the key numbers. Although the table I produced last time was OK, it didn't really work for me on all levels.

So... based on the latest data from the ONS the top line trends look like this:


Clearly we can see the number of deaths registered weekly as reported by the ONS for week 17 (week ending April 24th) is considerably above the average for the last 5 years. However in the most recently published data, it is good to see that the gap is no longer growing, which fits with the flattening of daily fatality numbers reported in government briefings around the same time.

If we take the worst case scenario, ignoring the lower number of deaths earlier in the year, and just compare week 10 to week 17 to the average we get the chart below. At this point it's important to note that these numbers portray a false sense of accuracy, so are best read to the nearest hundred, I work in absolutes to ensure the calculations add up, but the underlying data will be more variable so this level of accuracy is spurious. 


Since week 10 we have had approximately 38500 more deaths above trend (aka excess deaths), for the same period the ONS is reporting 29710 Covid-19 deaths which would leave a further 8800 (approx) deaths excess deaths as yet unexplained. In all likelihood a high percentage of these may well be Covid-19 deaths as well.  

However, there is a lag in the ONS data and the latest week is under-reported and subsequently 'topped up' the week after. An estimate for this top up is shown in the ONS Forecast column above, so I would expect the true reported figure to be closer to 32,000 deaths from Covid-19, leaving a figure in the region of 6400 unexplained excess deaths for weeks 10-17. So whilst the underlying number of Covid-19 deaths are likely to be higher than reported bye the ONS, the difference is starting to settle out at about one-sixth of excess deaths. It'll be interesting to see what number the media starts to announce as we move forward. 

I've included the daily Government briefing figures as well for completeness - these figures will always be lower than reality due to the speed of reporting and limited coverage of settings, but seem to be steadily running at about 80% of the final ONS figures and 60-65% of the level of excess deaths. 


Wednesday, May 6, 2020

Top 50 Countries - Covid-19 disease dynamics

Following on from my analysis of US states yesterday, today we look at the situation for major countries around the world using the same technique. (See chart below). Ideally you want to be low down on the y-axis (representing a low infection rate), be a small bubble (low absolute case size) and with decreasing trend (heading to the right). By contrast countries with large, growing numbers of new cases with high infection rates such as Brazil, Russia, Peru are a major cause for concern and Chile, Belarus and Saudi Arabia may well see significantly more cases before they turn the corner into decline. 


However, unlike the US analysis where we can assume we are most likely comparing apples with apples, we must treat this analysis with a degree of caution - different countries are measuring cases in different ways, so the case loads could represent differing levels of severity at different points in the disease lifecycle. Even worse would be the scenario where the basis of measurement is also changing which would give really misleading results.

A good example of this is the UK - the number of Pillar 1 cases (high severity, likely to be hospital admissions) have been falling steadily and yet the UK figures below shows a plateau in the chart above. This is caused by the recent inclusion of Pillar 2 results into the daily reporting, Pillar 2 tests are pro-active results from key workers, hence the results are misleading.

So, by all means enjoy the chart, but do treat with caution since we may not be comparing like for like. I suspect some form of segmentation looking at ratio of deaths of new cases would help identify how cases are being diagnosed - those with a higher death rate are probably nearer the hospital admission point, those with lower numbers will be more pro-active tests in the wider community. 


Tuesday, May 5, 2020

US Covid-19 Dynamics Sub-National Analysis

A little while ago I spent some time looking at the growth dynamics in the UK as a way of understanding the reason for the elongated plateau. With different regions being at different points in the lifecycle, decreases in one area were offset by increases elsewhere and hence the overall pattern appeared flat, whilst underneath, a much more complex situation was taking place.

Thanks to some fantastic data available on github here we can now repeat the same analysis for the US to see what is actually taking place and why the new case rate is stubbornly holding at about 30,000 new cases per day.

I found some very interesting charts on the New York Times website, which had neatly segmented each state into groups based on growth, however the accompanying charts were difficult to read and differently scaled which made comparison difficult. So I've gone back to my growth dynamic analysis to obtain the result below:


Here we see the position of each state in terms of week on week growth rate for new cases (note the reversed x-axis), the new cases per 100K population on the y-axis and the bubble size representing the number of new cases in the latest week.

The blue arrow shows a typical trajectory over time, although the actual shape and order of magnitude will vary on a case by case basis.

Overall the situation if quite balanced - some states still seeing a growth in cases, some flattening and some with declining rates of new cases. However the circles above will shift to the right in the coming weeks which will reduce the rate of new cases significantly and an overall decline in the national figures will follow quickly.

Some key turning points include several areas with declining rates of new cases, but on a high basis of infection (large circles to the upper right). These include New York, New Jersey and Massachusetts. These areas will no doubt have experienced extremely high loading on the local healthcare resources, but new cases are starting to decline, which will help reducing loading going forward.

By comparison California is seeing declining rates of new cases, but never peaked as high as the first group and Pennsylvania is just hitting peak now, but at a lower level than the first group. (Large circles, but lower on the y-axis).

Areas of concern are those states towards the upper left of the chart. Illinois has both high levels of infection, a high number of new cases and is still growing, so healthcare loading will be high and cases numbers will be off-setting the decreases seen elsewhere. However, based on analyses of other areas, cases may well peak here in the next few weeks.

Maryland, Iowa an Delaware are also still growing in areas with high infection rates, but are smaller numbers, so hopefully these areas will slow down too.

Nebraska is a potential concern, with high week on week growth of 77%, which has the potential to grow exponentially in the short term and could see some of the highest levels of new cases per 100K population recorded if the current trends continue.

Also of note here is Minnesota, new cases are growing rapidly here but on a relatively small base at the moment. Hopefully local measures will be able to reduce the increase in new cases and avoid the state following the full lifecycle shown by the blue line.

For those of you into your figures, please find the key figures from the diagram above in the tables below:


Thanks to the quality of the data for the US, it is easy to map the data (as below) and it is noticeable that the new cases (even when indexed to population) are clearly clustered to the East Coast of the US (see map below), with the other three larger column of note being Nebraska, Iowa and Illinois, which fits with the first chart perfectly.


To help visualise the spread of new cases in the US, I've creating the following animation that shows cumulative cases over time. I've omitted data before March 2020 for the sake of time and clarity.  


Unfortunately the high values in New York and New Jersey make it difficult to see many of the more subtle patterns in the data, so please find the version below with New York, New Jersey and small values excluded, which gives more insight into some of the other centres of infection in the US. 


Monday, May 4, 2020

Top 5 EU + USA update

UK:

Due to changes in reporting of both new cases and deaths it is becoming increasingly difficult to model the UK. I will spend some time revisiting the problem this week, but for now here is the latest position for the UK in terms of Pillar 1 new cases and deaths.

The rate of new cases continues to fall at a steady rate of 4% per day on average. There is, naturally,  some variability in the data but the underlying trend bodes well (and compares well with other countries).

Expect average daily deaths to be above 400 for the rest of the week and cumulative fatalities through this channel to approach 27,000 by the weekend.


France:

Now that the days of very spiky data appear to be behind us, the data and model for France is settling down nicely. New cases continue to fall at an increasing rate followed by daily deaths rates - it may be we see less than 100 deaths recorded for a single day in France at some point in the next week or so.


Italy:

The rate of new cases in Italy is falling away at about the same rate as the UK, on average about 4% per day. The decreases we saw a few weeks ago are now being reflected in the rate of daily deaths with figures halving in the space of just a few weeks.

Expect daily deaths to keep falling and to approach an average of less than 250 in the coming week. Cumulative figures will start to flatten off at the same point (see lower right chart) but are expected to reach the 30,000 mark at the weekend.


Spain:

The rate of new daily cases continues to hover around the 3,000 per day mark, although the last few days might suggest a new, decreasing trend has started (but it's too early to tell for sure).

My model shows that the ratio of historical new cases to deaths has shifted in the last 10 days or so, meaning that survival rates have now improved. This may reflect earlier or wider testing, but whatever the reason, predicted daily deaths are lower going forward - expect 200 per day for this coming week, with a cumulative figure approaching 26,000 by this time next week.


Germany:

New cases in Germany follow a distinct weekly pattern which can lead to short term increases followed by weekend dips. The overall trend though is towards lower numbers of new cases and a similar downward trend in fatalities (subject to local reporting standards).

If the current trends continue, expect 80 deaths per day on average for the coming week giving a total approaching 7,500 by May 10th.

Note: The weekly factoring model tested with the UK is now being also applied to German data


USA:

New cases are still flat at about 30,000 per day, although regionally, I suspect different underlying patterns are likely to be occurring.

The daily death rate in the USA is improving slightly as the ratio of historical new cases to deaths has fallen - my model has been tuned to reflect this going forward.

Expect a further 12,000 (approx) deaths in the next 7 days with a cumulative total approaching 80,000 by May 9th.

Note: The weekly factoring model tested with the UK is now being also applied to US data


Friday, May 1, 2020

UK Regions - New Case Evolution

For completeness, please find an updated of the rate of new Covid-19 cases in England by region based on data here. Unfortunately the usable parts of this data is about a week in arrears, so the trends seen below will not be too much of a surprise to anyone that follows the UK situation closely. 

With the exception of Yorkshire and the Humber which is fairly flat, most regions are seeing a reduction in the rate of new cases. The chart clearly shows how London was 7-10 days ahead of the rest of the country in terms of new cases and had the highest absolute peak of new cases at over 800 per day on average around April 3rd. 


If we normalise the data by population numbers we get the chart below. From here was can see that the North East had the highest relative amounts of new cases for a 7 day period starting April 4th - this fits with earlier regional analyses on this blog. The North West appears to have a similar peak loading to London offset but a few days, but the curve here is declining more slowly than London.

The East Midlands, West Midlands and the Yorkshire and the Humber lines are flat to slow declining compared to the other regions, so it would be interesting to understand the causes behind this in more detail, since this may provide valuable insight in managing the spread of Covid-19 going forward.


And finally, a quick summary of key numbers for the last available week which shows the differences in some of the key metrics, notice the wide variations in weekly decline, new daily cases and peak daily cases.

London vs New York City Update

Please find below the latest update of the Covid-19 infection trajectory comparing London with New York. Please treat the most recent data points with caution -  the number of new cases reported per day are usually revised upwards over time, so may change. I do remove the most recent data points from this analysis anyway, but changes to data points 10-14 days prior do still occur.


We can clearly see that both cities are now over the worst of the Covid-19 infection cases and we see a lower rate of infections per 100K of the population (y axis) and a steady reduction in case growth (x axis) in recent weeks. The overall loading of the health services in New York City still appear to be running at approximately twice that of London, but overall hospitalised cases should be at a manageable level now. 

For those of you who prefer to view the data from left to right, please find the same chart as above, but with the x axis reversed, so the left is increasing growth and the right is declining growth. This layout has the advantage that the trajectory over time follows nicely from left to right, but the reversed x-axis takes some getting used to. 

Personally, I'm not sure which layout is better, but I'm open to feedback on the matter. 


A quick look at Brazil

Brazil:

So, a quick snapshot of Covid-19 cases Brazil.

Brazil started off about a week behind the UK in terms of cases (31st March for 1000+ new cases compared to 23rd March for the UK). However since then the trajectory in Brazil has been quite different.

At the moment new cases are still growing at an exponential rate (seen by the straight dotted line on the logarithmic graph of cumulative new cases). Daily growth is averaging about 6.3% day on day, that's just over 50% growth week on week.


The daily rate of new cases (lower middle chart) shows no signs of real flattening as yet, but with four of the last size points being at the 6,000 mark, it's just possible the plateau may be starting to form. This won't be remotely conclusive until we see at least another 4 days or data.

As a general note, the data values for both new cases and fatalities are fairly erratic, which suggests some variability in reporting - possibly delays in correlating data across a large geographical area.

My model suggests that most of the cases reported above are fairly serious and a reasonably stable lag/probability relationship is observed.

Expect daily deaths for the coming week to average 500 per day, with daily values in the range of 300-800 due to noise and phasing. Expect total reported deaths to approach 9,000 by 5th May.